
Does raw GPU speed predict image generation time? Six cards, one surprisingly clean match for SDXL
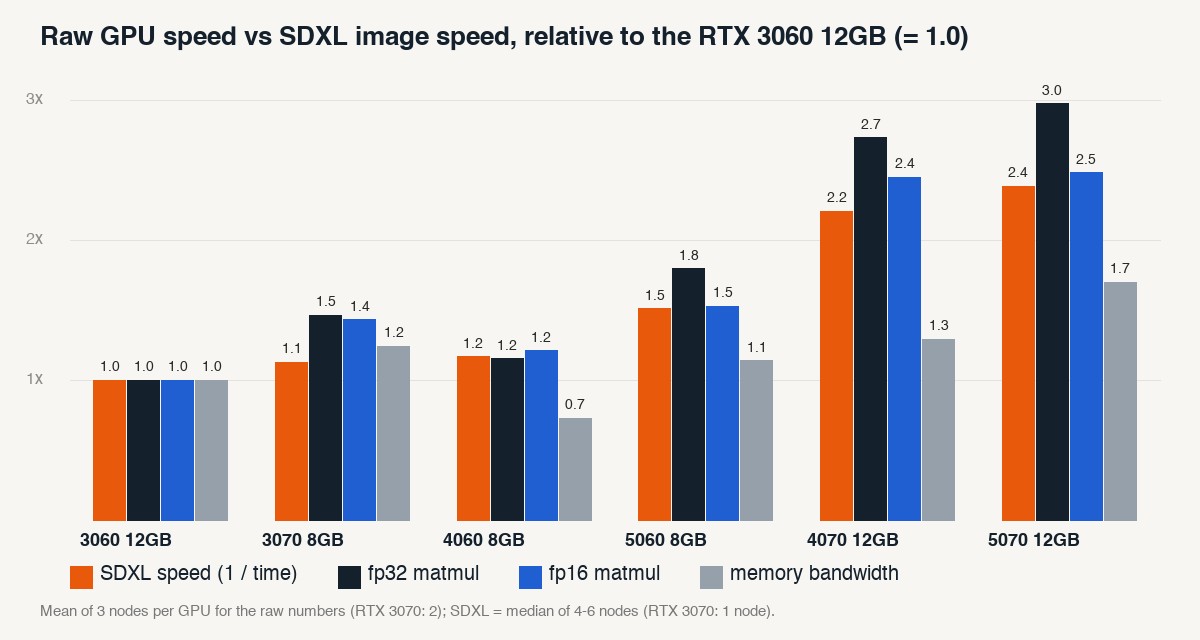
Every GPU review gives you a few raw numbers: how many trillion operations per second, how many gigabytes per second of memory. We wanted to know whether any of them predicts how long an image takes, because if one does, you can estimate your own card without running the model. We measured six GeForce cards both ways. For SDXL the answer was clearer than we expected. For one other model it already looks different, and we only have two cards to say so.
What we measured
For the raw numbers we wrote a small PyTorch script (it is not a standard benchmark program) that runs when a rented machine starts, before ComfyUI. It times a large matrix multiplication in fp16, bf16 and fp32 with TF32 switched off, an attention call in fp16 (the operation diffusion models spend a lot of time in), and a 1 GiB memory copy for bandwidth. The whole thing takes about 15 seconds. We ran it on two separate rented machines per GPU model where we could (the RTX 3070 has one so far), on PyTorch 2.13 with CUDA 13, and averaged the machines.
For the image side we used the SDXL medians already in our results table: 1024x1024, 30 steps, the same prompt and seeds on every machine, median of 4 to 6 machines per card (the RTX 3070 has one).
| Card (machines) | fp16 matmul (TFLOPS) | fp32 matmul (TFLOPS) | Attention fp16 (TFLOPS) | Memory (GB/s) | SDXL (s per image) |
|---|---|---|---|---|---|
| RTX 5070 12GB (2) | 62.9 | 19.6 | 66.5 | 574 | 8.8 |
| RTX 4070 12GB (2) | 65.7 | 17.9 | 62.0 | 441 | 9.5 |
| RTX 5060 8GB (2) | 38.9 | 11.8 | 39.7 | 387 | 13.9 |
| RTX 4060 8GB (2) | 31.1 | 7.7 | 30.9 | 247 | 18.0 |
| RTX 3070 8GB (1) | 34.8 | 7.5 | 34.2 | 452 | 18.6 |
| RTX 3060 12GB (2) | 25.2 | 6.2 | 23.6 | 344 | 21.0 |
What lined up
We compared each raw number with SDXL speed (one divided by the time) across the six cards. Two numbers per measure: the usual correlation, and a rank correlation that only asks whether the cards come out in the same order. The fp32 matrix speed matched almost perfectly (1.00 and 1.00, exactly the same order). Attention speed was next (0.99 and 0.94), then fp16 matrix speed (0.98 and 0.89). Memory bandwidth was the weakest (0.73 and 0.54). After adding the second machines, the fp16 rank agreement dropped a little and the bandwidth one dropped a lot, while fp32 held.
The chart shows the order and also a limit of the claim: the orange SDXL bar and the black fp32 bar climb in the same order, but they are not the same height. The RTX 5070 is 2.4 times faster than the RTX 3060 at SDXL but 3.2 times faster at fp32, partly because the 3060's fp32 number on one machine was low. So fp32 speed predicts the order of the cards, not the exact time. The clearest example is the RTX 4070 against the RTX 5070. The 4070 has the higher average fp16 matrix speed (65.7 against 62.9), yet the 5070 makes SDXL images faster, and the 5070 is also the one with the higher fp32 speed and much higher memory bandwidth.
How much to trust this
Not very much yet, and here is why.
- Six points. Any six numbers that rise together will correlate. We have not shown that fp32 speed causes SDXL speed.
- Two machines per card, and they disagree. The same card measured differently on different rented machines: the RTX 3060's fp32 result differed by 47% between its two machines (5.0 against 7.4 TFLOPS), the RTX 5070's fp16 by 17% and the 4070's by 12%. The RTX 5060 and 4060 repeated within 6%. We have not checked why (power limits, clocks or drivers are all untested), so the 4070-over-5070 fp16 gap is within the noise. The RTX 3070 still has one machine.
- We did not check precision. An fp32 match is surprising for a model that normally runs in half precision. We have not looked at which precision each stage of the pipeline used in our ComfyUI workflow, so we cannot say why fp32 tracks best.
- Our own script. It is transparent and cheap, but a result like this would be stronger if an independent, well-known benchmark agreed. We tried to add one: the download of Blender's command-line benchmark was refused (HTTP 403) from the rented machine, and a second attempt returned nothing, so we stopped.
A hint that the answer depends on the model
FLUX.2 [klein] 4B ran in about 3.1 s on the RTX 4070 and 3.3 s on the RTX 5070 (two machines each). That is the opposite order from SDXL, and it matches the average fp16 matrix speeds, where the 4070 is ahead, although with the spread above that lead is small. It could be that a transformer-style model leans on half-precision matrix speed while SDXL does not. With two cards and two machines each, this is a hypothesis, not a finding.
What we will try next
- Add a third round so every card has at least three machines, including the RTX 3070, and record each machine's clocks and power limit to see where the spread comes from.
- Record the precision of each stage in the SDXL workflow, and re-run with TF32 on.
- Add a FLUX.3 and a Z-Image run to see whether the FLUX.2 hint holds up on more cards.
- Try a well-known benchmark again from a different download source.
The raw numbers above are means of two runs (one for the RTX 3070) on 2026-10-24.